5 Rules to Follow When Using Infographics in Your Content Marketing
Infographics have become a very popular component of content marketing as many businesses have realized their ability to generate more shares than other types of content.

You will find that most blogs these days publish infographics, especially since there are several tools that make it easy to design them.
They are everywhere! This is why if you want to get the most out of infographics, just creating one randomly and publishing won’t work anymore. This worked in the past, but there is too much competition now.
To gain the same benefits that businesses did in the past, you need to follow a proper plan and create infographics that will drive results.
This is why to help you get the most out of your infographics I have put together this list of rules to follow while incorporating infographics into your content marketing…
1. Create Infographics On Popular Topics
If you want to benefit from the virality of infographics, you need to be very careful on the topics you choose. The best way to create highly shareable infographics is to create them on topics that tend to get more shares.
For example, let’s say you want to create an infographic on fitness hacks. You should begin your research by typing in this keyword into a tool like Social Animal. It will show you what content on that topic tends to attract the most shares.

After that, you can create an infographic on the same topic.
You can also type in the keyword, ‘infographic’ along with the keyword to see how well infographics on that topic performed.
Another way to figure out what types of content do well in your niche is by looking at your analytics. Tools like Google Analytics will show you what your most popular content is if you go to the ‘All Pages’ section. And if you go into the ‘Landing Pages’ section, you can also view content by conversion rate.
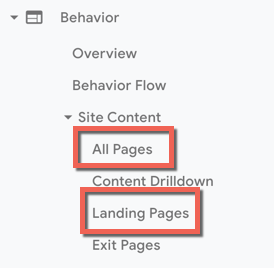
As these topics are already working well for you, it would be a good idea to create infographics on similar topics. You will not only be able to drive shares and traffic with these infographics, but you should also be able to convert them.
2. Make Sure They Are Visually Appealing
I know that this sounds obvious, but I wanted to mention it anyway as I regularly come across infographics that look very unappealing. This is why you should pay special attention to how good your infographics look. The better they look the greater the number of people who will be sharing them and republishing them on their website.
Here are a few tips for creating beautiful infographics…
Use a few colors
When designing infographics and other visuals for the first time, people make the mistake of filling them with multiple colors to make the infographic seem as attractive as possible. But this actually ends up making the infographic look hideous. This is why you should stick to only using 3 to 5 colors in every infographic.
If you are very new to design, it might be better for you to use a monochromatic color palette interspersed with neutral colors like white and black.
Limit the amount of text
You should also limit the amount of text as infographics are chiefly about using graphics to get your point across. Your readers want to see visuals. That is exactly why they prefer infographics over regular blog posts. The text just needs to add some relevance.
Allow plenty of negative space
Also, make sure you leave plenty of negative space around the text and visuals to get the most important elements to stand out. Quite often people like to fill up their infographics with a lot of content, but this makes them look crowded and repellent.
Brand the infographic
And make sure you brand the infographic with your logo and/or website URL at the end so that people know who created it. If they republish it elsewhere, they will make sure they credit you.
For some inspiration for designing beautiful infographics, you can check out the CoSchedule blog.
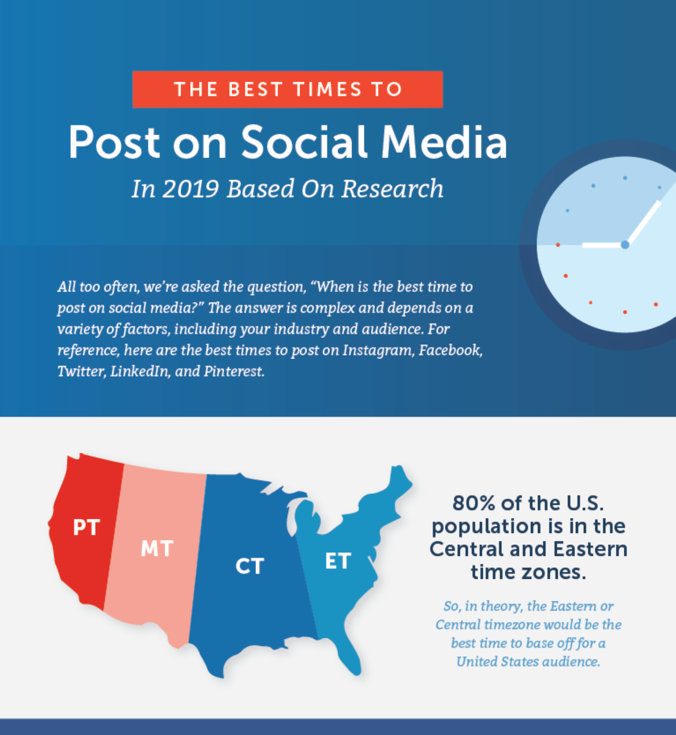
They regularly publish beautiful infographics like this one.
3. Ensure They Load Quickly
If you want to get the most out of your infographic you need to make sure it loads very quickly. As they are usually a large file, they can sometimes take a while to load and this can cost you both shares and conversions as people don’t like to wait long for it to load.
If your infographic doesn’t load in a few seconds most of your visitors will abandon the page. So, here are a few things you can do to ensure your infographic loads quickly.
Get a good hosting service
The most common culprit that affects the loading time is the hosting service. There are many unreliable services out there that provide a bad server which leads to your site loading too slowly or crashing too often. So, make sure you use a good hosting service. To quickly find the right service, you can check out this page on WhoIsHostingThis.
Here you will find a list of reviews of the top hosting services.
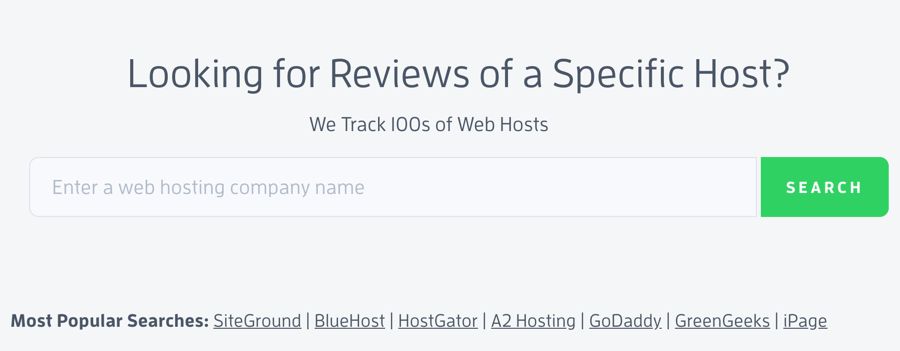
You can even search for a host and read reviews about them.
Divide the infographic into several bits
Another way to get an infographic to load quickly is by dividing it up into bits and then publishing the different images one below the other. As they are smaller individual images they will load faster.
Reduce the size of your infographic
If you prefer publishing the infographic as a whole, you can just reduce the size of the infographic. To help you with this you can use ShortPixel. It is a WordPress plugin that will automatically reduce the size of the image without sacrificing quality.
4. Promote Them
If you want people to check out your infographics and share them, you need to promote them as much as you can. The more you promote them, the more the number of people will visit your website and convert to customers and/or share the infographics with their followers. Here are a few ways to promote your infographics…
Share it with your followers
If you have a good following you can share the infographics with your followers.
Email outreach
The most affordable and effective way to promote your infographics is through email outreach. This is where you reach out to bloggers via email and ask them to share the infographics with their followers and publish it on their blog too.
You will be surprised at the number of people who will happily publish your infographics on their blog for free.
To improve your approval rate, you can let them know that you are ready to write the text that will accompany the infographics to make things easier for them.
Ads
If you have the budget, you can use ads to promote your infographics. This will help you see quicker results.
5. Measure Their Performance
The above techniques will help you drive some traffic and shares. This will help you gather a lot of data. Make sure you track this information and use it to create better infographics in the future. You especially want to pay attention to the comments they write as you can find your next infographic idea there.
The data can also be used to better promote your infographic.
Conclusion
These are the 5 rules you must follow while using infographics in your content marketing. Begin following them today to drive more shares and traffic quickly.
Featured image: Copyright: ‘https://www.123rf.com/profile_kittisaktaramas‘ / 123RF Stock Photo
Latest posts by Mitt Ray (see all)
- 5 Rules to Follow When Using Infographics in Your Content Marketing - January 30, 2020
- How to Create an Online Course That People Will Buy - January 15, 2020